Bitcoin’s Market Cap History: Milestones, Cycles, and How to Read the Signal
Bitcoin’s market capitalization history is a fast-moving story of technology adoption, market structure, and shifting trust in money. Market cap is not “the amount of dollars inside Bitcoin.” It is a valuation snapshot: the latest traded price multiplied by the number of coins in circulation. That simple formula makes Bitcoin’s market cap a powerful headline number—and also a metric that can be misunderstood if you ignore liquidity, distribution, and how supply actually enters the market.
Table of Contents
- What “Market Cap” Really Means for Bitcoin
- The Early Era (2009–2012): A Market Cap That Barely Existed
- First Big Cycles (2013–2016): Market Cap Learns to Move
- The 2017 Cycle: When Market Cap Went Mainstream
- 2020–2022: Institutionalization, Then a Stress Test
- 2024–2026: ETFs, New Highs, and a New Kind of Volatility
- A Practical Framework: What Drives Bitcoin Market Cap
- How to Use Market Cap in Decision-Making
- Top 5 Frequently Asked Questions
- Final Thoughts
- Resources
What “Market Cap” Really Means for Bitcoin
- Bitcoin market cap is best treated as a valuation snapshot, not a bank balance. It expresses what the market collectively implies the network is worth at the current marginal price.
- Because Bitcoin trades continuously and globally, its market cap updates in real time. That makes it a useful high-level barometer of sentiment and adoption, but also a metric that can swing dramatically when liquidity is thin or leverage is high.
- In innovation terms, market cap is a lagging-and-leading hybrid: it lags real-world usage in some periods, and in other periods it leads via expectations about future adoption.
How Bitcoin Market Cap Is Calculated
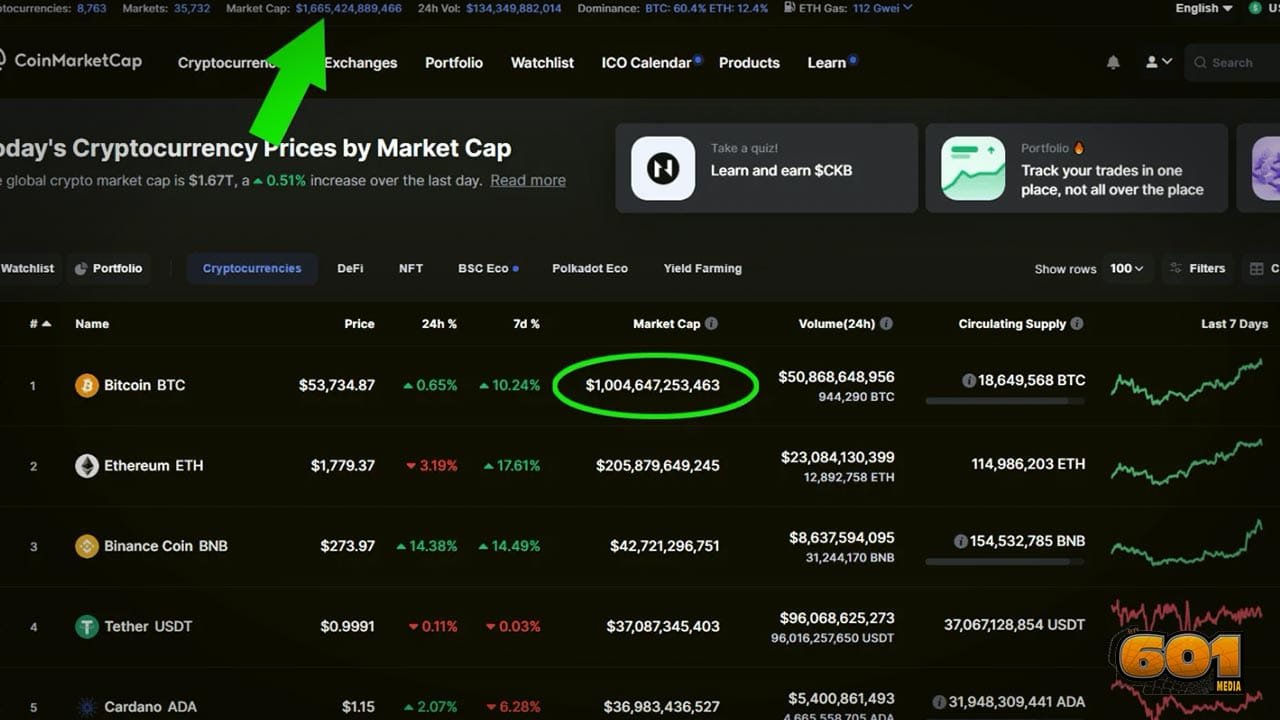
- The standard approach used by major data providers is: Market Cap = Price × Circulating Supply.
- “Circulating supply” is an estimate of the number of coins available to the public, conceptually similar to “public float” in equities.
- Bitcoin’s circulating supply is high relative to its eventual maximum because issuance began in 2009 and continues on a predefined schedule that declines over time.
Circulating vs. Fully Diluted Market Cap
- Circulating market cap uses the coins currently in circulation. It is the most common headline figure, and it aligns with how many platforms rank cryptoassets.
- Fully diluted valuation (FDV) uses the maximum supply assumption (for Bitcoin, commonly referenced as 21 million) multiplied by price, which can be useful for scenario analysis but can be misleading when applied to assets with large future emissions. For Bitcoin specifically, FDV is closer to circulating market cap than it is for many tokens because issuance is already advanced.
What Market Cap Does (and Does Not) Tell You
- Market cap does tell you scale and relative size. When Bitcoin crosses levels like $1 trillion, it tends to change who can allocate (institutions with policy limits, benchmarks, or minimum liquidity requirements).
- Market cap does not tell you liquidity depth. A high market cap can still coexist with violent selloffs if leverage unwinds or if buyers step back temporarily.
- Market cap does not capture “lost coins.” Coins that are effectively unrecoverable still sit in circulating supply estimates, which means market cap can overstate economically available supply. This is one reason market cap should be paired with liquidity and on-chain behavior metrics when making decisions.
The Early Era (2009–2012): A Market Cap That Barely Existed
- In Bitcoin’s first years, the network was closer to an experiment than a mature market. Trading venues were limited, and price discovery was fragile. That meant market cap existed mathematically, but the number carried less informational weight than it does today.
- From a technology management perspective, this is the “pre-diffusion” stage: the system proves technical viability, early communities form, and supporting infrastructure is thin. Valuation signals are dominated by scarcity narratives and small participant sets.
Genesis, Mining Subsidy, and Why Supply Grows Predictably
- Bitcoin’s issuance is policy by software. New supply enters through mining rewards, and the reward halves roughly every four years (every 210,000 blocks), reducing the pace of new supply over time.
- The April 2024 halving reduced the block subsidy to 3.125 BTC, reinforcing the long-term scarcity narrative that often underpins market cap expansions in post-halving periods.
Thin Liquidity: Why Early Market Cap Was More Symbolic Than Useful
- When only a small amount of Bitcoin is actively traded, the marginal price can move a lot on relatively little volume. Market cap therefore can look “large” compared with how much capital could actually be exited without slippage.
- This is a classic pitfall in emergent markets: headline valuation outpaces market depth. For analysts, it’s a reminder to treat early market cap history as a narrative indicator more than a tradability indicator.
First Big Cycles (2013–2016): Market Cap Learns to Move
- By 2013, Bitcoin had enough exchange presence and public awareness to experience a recognizable boom-and-bust cycle. Market cap became a shorthand for “is this getting bigger?” because it combined price momentum with a steadily rising circulating supply.
- In innovation terms, this phase resembles early diffusion: new user cohorts arrive, infrastructure improves, and narratives start to compete (payments rail vs. store of value).
2013: Bitcoin Becomes “A Thing,” and Valuation Follows
- The key feature of 2013 isn’t any single number—it’s the emergence of recurring market behavior: rapid repricing, then drawdowns that cleanse excess speculation.
- Those repeated cycles matter because they train participants and build institutional memory. Over time, that memory becomes part of market structure, influencing leverage, hedging, and long-term holding behavior.
Exchanges, Custody, and the Infrastructure Effect
- Market cap growth depends on more than demand; it depends on access. Better exchanges, safer custody, and clearer pricing indices reduce friction. Each improvement expands the potential investor base and tends to make market cap more “real” in a liquidity sense.
- Data platforms that standardize market cap calculation (Price × Circulating Supply) make the asset legible to broader audiences and media.
The 2017 Cycle: When Market Cap Went Mainstream
- 2017 is widely remembered as the cycle where Bitcoin’s valuation reached mass awareness. The market cap became a headline metric in mainstream outlets, and “how big can it get?” became a dinner-table question.
- From a technology adoption lens, 2017 reflected a narrative acceleration: users didn’t need to understand the system to buy exposure, and that dramatically broadened participation.
Retail Adoption and Narrative Multipliers
- Retail-heavy waves can expand market cap quickly because they feed reflexive dynamics: rising prices create attention, attention creates new buyers, and the marginal bid increases price again.
- The flip side is fragility: when the story changes (or when liquidity tightens), market cap can compress quickly because the same reflexivity works in reverse.
The Reset: Why Market Cap Retraced So Hard
- Large drawdowns after euphoric peaks are common in emergent technologies. They are not just “price corrections”; they are governance and credibility stress tests.
- In innovation management, this resembles a shakeout phase: weaker projects and overextended actors exit, while surviving infrastructure and serious builders continue. Bitcoin’s repeated survival through these resets is part of why the market cap regained and surpassed prior peaks later.
2020–2022: Institutionalization, Then a Stress Test
- 2020–2021 featured a broad institutional narrative: corporations explored Bitcoin as a treasury asset, large financial institutions expanded crypto services, and market infrastructure matured.
- By 2022, the system endured a major stress test that highlighted the risks of leverage, opaque balance sheets, and counterparty exposure—factors that can destroy market cap quickly when confidence breaks.
Macro, Corporate Treasuries, and Legitimacy
- Institutional participation tends to influence market cap in two ways: it can increase demand directly, and it can change expectations about long-term adoption, which affects valuation even before new demand fully arrives.
- Legitimacy effects matter: when widely recognized institutions engage, it reduces career risk for other allocators, which can compound flows over time.
Crossing $1 Trillion: What It Signaled
- Bitcoin’s market cap reaching $1 trillion for the first time in early 2021 was a symbolic threshold that placed it in the same conversational category as major large-cap assets.
- Bitcoin also moved back above $1 trillion in February 2024, supported by market structure changes and fresh sources of demand highlighted in contemporaneous reporting.
- For strategy teams, “trillion-dollar” status can matter because it often correlates with improved liquidity, broader coverage, and tighter spreads—conditions that influence whether big pools of capital are allowed to participate.
2022 Drawdown: Leverage, Contagion, and Confidence
- One reason market cap history is so jagged is that crypto markets can build leverage quickly. When forced selling begins, price falls, market cap contracts, collateral value drops, and additional forced selling can follow.
- For innovation leaders, the takeaway is governance-by-market: risk management and transparency become competitive advantages for platforms and service providers during downturns.
2024–2026: ETFs, New Highs, and a New Kind of Volatility
- By 2024–2026, Bitcoin’s market cap dynamics increasingly reflected a blend of retail behavior and institution-grade access routes (including exchange and brokerage rails that feel familiar to traditional investors).
- This era is also a reminder that “bigger” does not mean “stable.” Large market caps can still experience rapid repricing when macro conditions, policy signals, or sentiment shifts hit simultaneously.
Back Over $1 Trillion (Again): A Different Market Structure
- Reporting in February 2024 highlighted Bitcoin’s market cap moving above $1 trillion again for the first time since late 2021, reflecting renewed demand and evolving access mechanisms.
- For market cap interpretation, the key point is not only the number but the “why”: who is buying, through what vehicles, and with what constraints. Market structure changes can make the same headline market cap mean something different than it did in prior cycles.
2025: New All-Time Highs and Market Cap Peaks
- In early October 2025, widely cited market coverage reported Bitcoin reaching record price levels above $125,000. Because market cap is Price × Circulating Supply, those price peaks translated into record-high market capitalization as well.
- Coinbase reported an all-time high around October 6, 2025, consistent with broader market reporting about the period’s peak.
- From a valuation narrative standpoint, this period illustrates how quickly market cap can expand when (1) demand concentrates, (2) supply issuance is predictable and relatively slow, and (3) the market believes adoption is entering a higher-probability regime.
2026: Sharp Corrections and What They Reveal
- In early February 2026, major outlets described Bitcoin falling sharply from its October 2025 record highs, underscoring that even at large scale, crypto can reprice quickly.
- These corrections are not noise for decision-makers; they reveal where leverage exists, where liquidity disappears first, and how correlated Bitcoin becomes with broader risk sentiment during stress windows.
A Practical Framework: What Drives Bitcoin Market Cap
- Bitcoin’s market cap moves when price moves, and price moves when marginal buyers and sellers disagree sharply. That disagreement is shaped by demand sources, supply dynamics, liquidity, and trust.
- The most practical way to interpret market cap history is to treat it as an output variable. Then ask: what inputs changed in that era?
Demand Sources: Retail, Institutions, ETFs, and Treasuries
- Retail demand tends to be narrative-driven and momentum-sensitive. It can expand market cap quickly during bullish phases but also retreat quickly in risk-off moments.
- Institutional demand tends to be process-driven: investment committees, custody requirements, benchmark constraints, and regulatory clarity. Once participation is authorized, flows can be stickier, but not immune to macro shocks.
- The key managerial question is not “who bought?” but “who can keep buying?” Sustainable market cap growth usually requires repeatable inflow channels, not one-time bursts.
Supply Dynamics: Halvings, Issuance, and Long-Term Scarcity
- Bitcoin’s issuance declines over time due to halvings, which occur roughly every four years. The 2024 halving reduced the block reward to 3.125 BTC, lowering the pace of new supply entering the market.
- Because market cap uses circulating supply, the supply side is slow-moving compared with price. That means big demand surges can expand market cap disproportionately—especially in periods where available liquidity is constrained.
- From a strategic lens, halvings are less a “price trigger” and more a supply policy milestone that changes the economics of mining and the long-term scarcity narrative investors reference.
Liquidity, Market Microstructure, and “Reflexivity”
- Market cap can grow faster than liquidity. When that happens, small shifts in marginal demand can have outsized effects on price and therefore market cap.
- Reflexivity is the feedback loop: price increases lift market cap, higher market cap attracts attention and legitimacy, legitimacy draws in new buyers, and the loop continues—until it doesn’t.
- For operators and investors, monitoring leverage and liquidation risk matters because deleveraging compresses market cap quickly, regardless of long-run narratives.
Trust, Regulation, and Policy Shocks
- Trust is a valuation multiplier. Custody practices, exchange integrity, and clear rules can support higher market cap regimes by reducing perceived tail risk.
- Policy news can shift market cap quickly because it changes the probability distribution of future adoption (for example, whether large allocators are “allowed” or “comfortable” to participate).
- During stress, correlations rise. Bitcoin can trade like a high-beta risk asset in the short term even if long-term holders see it as digital gold.
How to Use Market Cap in Decision-Making
- Market cap is best used as a triage metric: it tells you size, relevance, and broad regime (micro-cap experiment vs. macro-scale asset). Then you validate with other metrics: liquidity, volatility, drawdown behavior, custody/venue risk, and adoption indicators.
- If you are building products or policy, market cap history helps you anticipate stakeholder behavior. At higher market caps, failures have wider spillovers, and regulatory attention tends to intensify.
Benchmarking Bitcoin Against Other Asset Classes
- Market cap enables apples-to-apples conversation with equity market caps and commodity market values, even though the mechanics differ. It helps investors and executives answer: “Is this niche, or is this systemically relevant?”
- Crossing thresholds like $1 trillion has been repeatedly treated as a milestone in major market commentary.
Risk Management: Drawdowns, Regime Shifts, and Position Sizing
- Bitcoin’s market cap history includes periods of rapid expansion followed by severe drawdowns. For portfolio design, that implies regime-based thinking: risk-on phases behave differently than deleveraging phases.
- Practical risk controls often focus on (1) liquidity planning, (2) custody and counterparty risk, (3) leverage avoidance, and (4) an explicit drawdown budget aligned with the asset’s historical behavior.
- In early February 2026, reporting described Bitcoin trading materially below its October 2025 peak, illustrating the speed of market cap compression during stress.
Innovation & Technology Management Lens: Adoption Curves and Standards
- Bitcoin market cap history maps onto a familiar innovation arc: invention and early experimentation, infrastructure buildout, diffusion via narratives and access, institutional standardization, and repeated stress tests that strengthen (or break) market confidence.
- In technology management, you track complements: custody, compliance, data quality, and distribution. When complements mature, total addressable participation increases—and market cap can re-rate upward without any change to the underlying protocol.
- Because market cap is a public, constantly updated metric, it acts as a coordination signal for the ecosystem. Builders, exchanges, and financial firms use it to prioritize support, allocate resources, and justify investment in integration.
Top 5 Frequently Asked Questions
No. Market cap is price multiplied by circulating supply. It reflects a valuation at the marginal traded price, not the total amount of dollars that entered the market.
Because price changes fast, and market cap is directly proportional to price. Supply changes slowly; price changes instantly.
Circulating market cap uses coins currently circulating; FDV uses the maximum supply assumption. For Bitcoin, both are often cited because the max supply is well known and issuance is far along.
Major market commentary identifies early 2021 as the first time Bitcoin’s market cap reached $1 trillion, with later re-entries above that level including February 2024.
Use it as a scale indicator and a liquidity/coverage proxy, but pair it with volatility, drawdown history, and market structure analysis. Market cap alone does not tell you stability.
Final Thoughts
- The most important takeaway from Bitcoin’s market cap history is that valuation is inseparable from infrastructure and trust. The formula is simple—Price × Circulating Supply—but the drivers are complex: access pathways, custody maturity, macro liquidity, leverage, regulation, and the credibility of the “store of value” narrative.
- If you treat market cap as a single scoreboard, you will miss the game. The real signal comes from connecting market cap regimes to what changed underneath: who gained access, what institutions could participate, how issuance constraints evolved around halvings, and what risks (counterparty, leverage, policy) were rising in the background.
- From an innovation and technology management standpoint, Bitcoin’s repeated cycle pattern is not just speculation—it is diffusion under uncertainty. Each boom expands awareness and adoption; each bust stress-tests the ecosystem, removes weak structures, and forces upgrades in market plumbing. That is why market cap history looks like a staircase with collapses: it is an adoption curve expressed through a market that reprices expectations faster than real-world integration can catch up.
- Used correctly, market cap is a strategic compass: it helps you gauge ecosystem scale, stakeholder attention, and the likelihood of continued institutionalization. Used carelessly, it becomes a misleading headline. The difference is context—especially liquidity, market structure, and the quality of the rails that connect capital to the asset.
Resourses
- CoinMarketCap Support: “Market Capitalization (Cryptoasset, Aggregate)” (definition and formula).
- CoinMarketCap FAQ: “Market Cap = Price × Circulating Supply.”
- CoinMarketCap Support: “Supply (Circulating, Total, Max)” (circulating supply concept and analogy to public float).
- Blockchain.com Charts: “Market Capitalization (USD)” and “Total Circulating Bitcoin” (market cap definition and supply series context).
- Investopedia: Bitcoin halving overview and April 2024 halving reward (3.125 BTC).
- Reuters: Coverage of Bitcoin record highs above $125,000 in October 2025.
- Coinbase: Bitcoin price page noting all-time high reached October 6, 2025.
- Reuters: Feb 14, 2024 reporting on Bitcoin market cap surpassing $1 trillion again.
- CME Group: Historical milestones including $1 trillion market cap reached in February 2021.
- Selected contemporary market context (early Feb 2026) describing drawdown from Oct 2025 highs.